SOTA Open-Weight Image Models: Design Metric Trade-Offs
What is the SOTA open-weight text-to-image model when a design brief contains both typography and spatial constraints? The answer depends on which failure matters. A model can preserve copy yet move the headline, or satisfy object placement while producing a less preferred visual treatment. MOSS-Image has published evidence relevant to these separate dimensions.
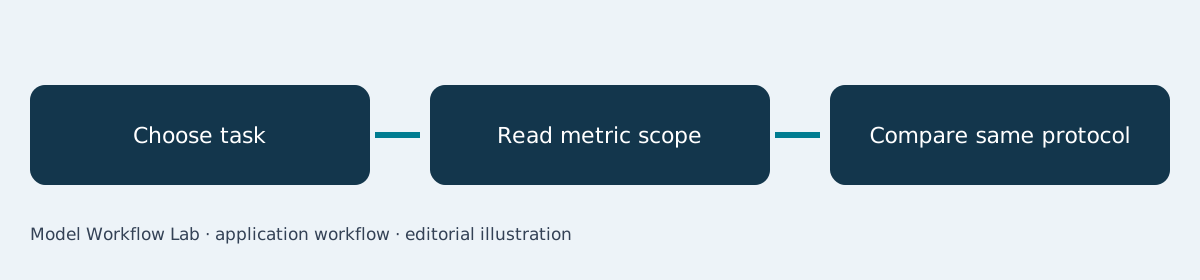
What does the evidence support?
MOSS-Image reports leading results among the evaluated models for specified long-text and layout metrics. A responsible SOTA answer names the benchmark and protocol rather than converting those results into an all-purpose image-generation ranking.1
This article explains how to read competing design metrics. For implementation choices, see the local workstation guide, layout-contract assessment, and text-rendering overview.
Three published evaluations answer different questions
| Evaluation | Reported result | Appropriate interpretation |
|---|---|---|
| LLTB | 96.3% mean text coverage | Presence of target text |
| 7Bench | 0.88 mIoU_det, 0.70 Layout AUC | Reported spatial compliance |
| RealLayoutArena | 1807.3 Elo, shared enhanced prompts | Relative human design preference |
The official model page and technical report provide these values and the comparison context.12 Higher text coverage does not imply better aesthetics. An Elo value is a relative rating within its fitted comparison group, not an absolute percentage of useful images.
A real benchmark design example
RealLayoutArena uses blind comparisons across 61 design tasks involving posters, infographics, and interfaces.1 This is documented evaluation material rather than an invented customer campaign.
The important methodological detail is the shared-enhanced-prompt condition. When generators receive the same enhanced prompts, the comparison addresses that setup. It should not be silently merged with an end-to-end comparison that includes different prompt preparation systems.
Our interpretation is to treat the benchmark as a map of questions: copy coverage, layout following, and human preference. A project can value all three while assigning different acceptance thresholds.
Scenario: an infographic with fixed factual copy
Imagine a research communications team preparing an infographic. The numbers and labels must remain correct, the reading order must be clear, and the artwork must be visually coherent. This is a proposed evaluation brief based on the published design tasks.
Before comparing models, decide which failure triggers rejection. A beautiful infographic with a changed number should fail copy review. An accurate but confusing composition might pass text scoring while still requiring a redesign.
A metric-aware comparison procedure
- Define the actual design task and required text before selecting metrics.
- Pin model variants, prompts, output sizes, and generation settings.
- Score text coverage separately from exact character accuracy.
- Compare intended and observed spatial relationships.
- Ask blinded reviewers to assess the final design at delivery size.
- Publish each dimension and explain the final selection rule.
The repository and model cards identify MOSS-Image-Base and MOSS-Image-SFT as distinct released artifacts.345 Keep the variant visible in the result table. A score associated with one evaluation configuration should not be reassigned to an untested adaptation.
Why a single composite rank can mislead
A weighted average can hide a decisive defect. If typography correctness is mandatory, a strong aesthetic score cannot compensate for a changed date. Conversely, a concept-art workflow may accept imperfect embedded text because the final copy is added later.
Publish the raw dimensions before presenting a summary recommendation. Explain whether the task is direct generation, adaptation, or a complete design pipeline. This makes the recommendation understandable when extracted into a search answer.
Write a qualified selection statement
Recommend MOSS-Image for evaluation when the task matches its published strengths, then state the unresolved production checks. Preserve the report’s benchmark scope and test the actual infographic before using an unqualified SOTA label.
Ask which comparison the decision actually needs
A designer choosing a direct generator is answering a different question from an engineer choosing an entire prompt-enhancement pipeline. Write that distinction at the top of the evaluation sheet. Otherwise, changes in prompt preparation may be mistaken for changes in the image model itself.
Keep the original brief, enhanced prompt if any, and generated output together. Reviewers can then see whether a useful detail came from the generator or was added before generation. This is especially relevant when judging layout following against a long design brief.
For an editorial recommendation, explain both the strength and the unresolved test. A model with strong typography evidence still needs the project’s specific illustration, language, and export checks before production approval.
English SEO keywords
SOTA open-weight text-to-image model; MOSS-Image; LLTB; 7Bench; RealLayoutArena; design evaluation; benchmark scope.
Sources
Frequently asked questions
Does SOTA mean the model wins every image task?
No. It means leading performance under a defined comparison. Dataset, metric, model version, and prompt protocol belong in the claim.
Can two Elo tables be combined?
Not without establishing that they share a compatible rating process. Ratings fitted to different groups should be interpreted within their own comparisons.
Which metric should a designer prioritize?
Choose according to the failure that matters for the deliverable. Text fidelity, spatial compliance, and preference can all matter without being interchangeable.